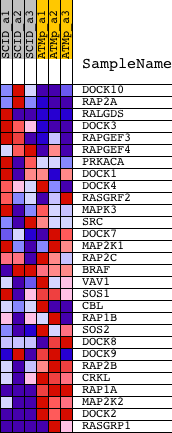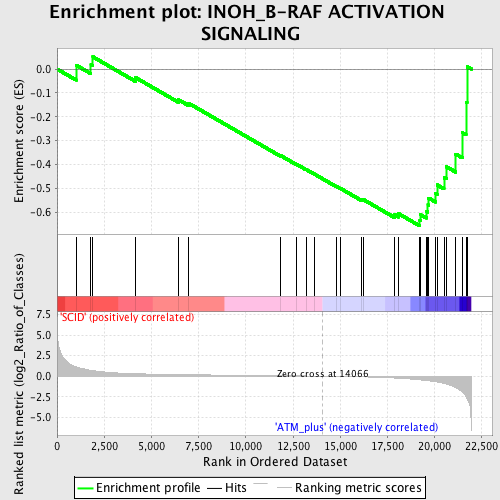
Profile of the Running ES Score & Positions of GeneSet Members on the Rank Ordered List
| Dataset | Set_01_SCID_versus_ATM_plus.phenotype_SCID_versus_ATM_plus.cls #SCID_versus_ATM_plus.phenotype_SCID_versus_ATM_plus.cls #SCID_versus_ATM_plus_repos |
| Phenotype | phenotype_SCID_versus_ATM_plus.cls#SCID_versus_ATM_plus_repos |
| Upregulated in class | ATM_plus |
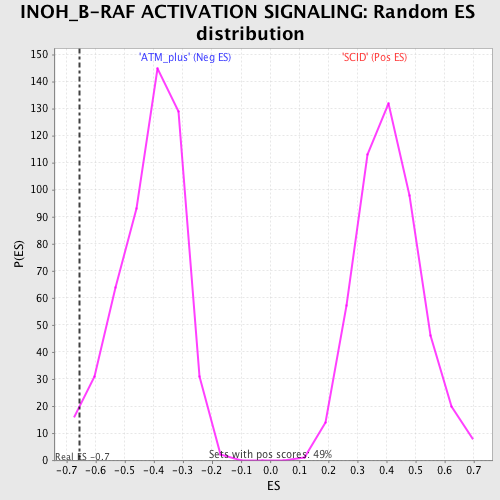
| GeneSet | INOH_B-RAF ACTIVATION SIGNALING |
| Enrichment Score (ES) | -0.6573318 |
| Normalized Enrichment Score (NES) | -1.5968993 |
| Nominal p-value | 0.011741683 |
| FDR q-value | 0.2536213 |
| FWER p-Value | 0.995 |
| PROBE | DESCRIPTION (from dataset) | GENE SYMBOL | GENE_TITLE | RANK IN GENE LIST | RANK METRIC SCORE | RUNNING ES | CORE ENRICHMENT | |
|---|---|---|---|---|---|---|---|---|
| 1 | DOCK10 | 1443349_at 1444878_at | 1006 | 1.141 | 0.0165 | No | ||
| 2 | RAP2A | 1421574_at 1426965_at 1440473_at | 1793 | 0.707 | 0.0193 | No | ||
| 3 | RALGDS | 1460634_at | 1896 | 0.669 | 0.0513 | No | ||
| 4 | DOCK3 | 1428852_at 1452930_at | 4148 | 0.298 | -0.0352 | No | ||
| 5 | RAPGEF3 | 1424470_a_at 1424471_at 1437012_x_at 1437946_x_at 1438590_at | 6433 | 0.197 | -0.1287 | No | ||
| 6 | RAPGEF4 | 1421622_a_at 1425518_at 1440274_at 1444034_at | 6951 | 0.180 | -0.1424 | No | ||
| 7 | PRKACA | 1447720_x_at 1450519_a_at | 11849 | 0.056 | -0.3629 | No | ||
| 8 | DOCK1 | 1443390_at 1443760_at 1443991_at 1452220_at 1457806_at | 12664 | 0.037 | -0.3980 | No | ||
| 9 | DOCK4 | 1431114_at 1436405_at 1441462_at 1441469_at 1446283_at 1457146_at 1459279_at | 13206 | 0.024 | -0.4214 | No | ||
| 10 | RASGRF2 | 1421621_at | 13614 | 0.012 | -0.4393 | No | ||
| 11 | MAPK3 | 1427060_at | 14783 | -0.022 | -0.4914 | No | ||
| 12 | SRC | 1423240_at 1450918_s_at | 14992 | -0.030 | -0.4993 | No | ||
| 13 | DOCK7 | 1425315_at 1448892_at | 16099 | -0.075 | -0.5457 | No | ||
| 14 | MAP2K1 | 1416351_at | 16232 | -0.082 | -0.5472 | No | ||
| 15 | RAP2C | 1428119_a_at 1437016_x_at 1460430_at | 17887 | -0.222 | -0.6106 | No | ||
| 16 | BRAF | 1425693_at 1435434_at 1435480_at 1442749_at 1445786_at 1447940_a_at 1447941_x_at 1456505_at 1458641_at | 18093 | -0.251 | -0.6062 | No | ||
| 17 | VAV1 | 1422932_a_at | 19214 | -0.442 | -0.6331 | Yes | ||
| 18 | SOS1 | 1421884_at 1421885_at 1421886_at | 19240 | -0.448 | -0.6098 | Yes | ||
| 19 | CBL | 1434829_at 1446608_at 1450457_at 1455886_at | 19555 | -0.527 | -0.5953 | Yes | ||
| 20 | RAP1B | 1435518_at 1435519_at 1455349_at | 19642 | -0.548 | -0.5692 | Yes | ||
| 21 | SOS2 | 1452281_at | 19678 | -0.557 | -0.5404 | Yes | ||
| 22 | DOCK8 | 1431961_at 1433437_at 1439226_at 1449419_at | 20045 | -0.675 | -0.5202 | Yes | ||
| 23 | DOCK9 | 1445232_at 1446803_at 1446833_at 1446927_at | 20128 | -0.707 | -0.4852 | Yes | ||
| 24 | RAP2B | 1417914_at 1417915_at 1439548_at 1448885_at | 20493 | -0.868 | -0.4544 | Yes | ||
| 25 | CRKL | 1421953_at 1421954_at 1425604_at 1436950_at | 20621 | -0.933 | -0.4091 | Yes | ||
| 26 | RAP1A | 1424139_at | 21116 | -1.376 | -0.3564 | Yes | ||
| 27 | MAP2K2 | 1415974_at 1443436_at 1460636_at | 21462 | -1.936 | -0.2662 | Yes | ||
| 28 | DOCK2 | 1422808_s_at 1437282_at 1438334_at 1459382_at | 21660 | -2.487 | -0.1392 | Yes | ||
| 29 | RASGRP1 | 1421176_at 1431749_a_at 1434295_at 1450143_at | 21713 | -2.773 | 0.0102 | Yes |